房价预测模型
项目数据来源于kaggle,为House Prices Prediction.这是一份用于回归预测的数据集。其目的是利用数据集中的特征数据,来预测房屋的销售价格(SalePrice)。评判规则为均方根误差,即预测售价与实际售价相符的程度。查看数据发现,共有81个变量,其中第一个为ID,最后一个为SalePrice,即要预测的目标值。
import matplotlib.pyplot as plt
import pandas as pd
import seaborn as sns
import numpy as np
#导入训练集
d_train=pd.read_csv('https://zhuanlan.zhihu.com/p/train.csv')
#导入测试集
d_test=pd.read_csv('https://zhuanlan.zhihu.com/p/test.csv')

#data.head(10)
#查看训练集情况
print (d_train.info())
#训练集描述统计
print (d_train.describe())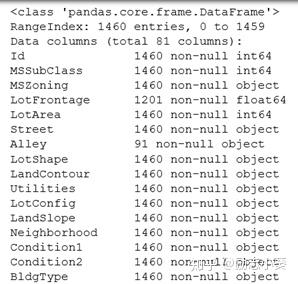
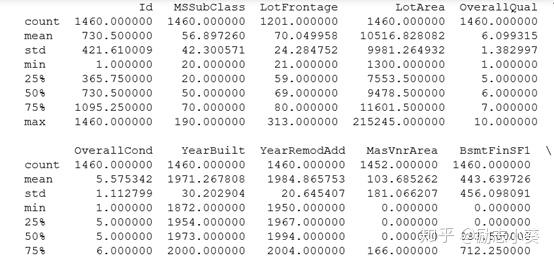
通过上面代码,可以看出训练集共有1460条房屋记录,共81列数据,其中第一列是ID值,最后一列是房屋价格。测试集共有1459条房屋记录,共80列数据。且数据集存在大量缺失值。
分析目的:首先需要寻找影响房价的因素,其次利用训练集构建模型对测试集进行预测。
分析思路如下:

- 令所有变量与房价做相关性分析
corr=d_train.corr()
plt.subplots(figsize=(12,9))
sns.heatmap(corr,vmax=0.9,square=True,linecolor='white')
plt.show()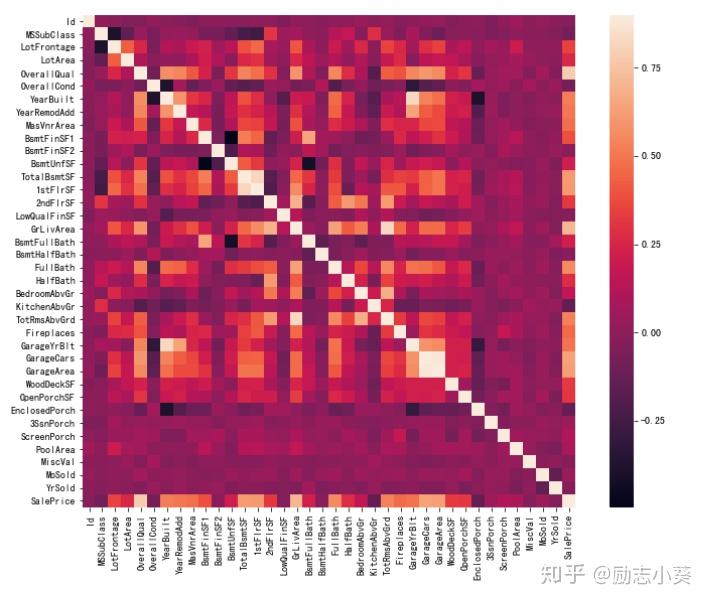
观察最后一行,发现SalePrice和10个变量相关性较强,下面对这十个变量进一步观察。
#相关性矩阵
k=11
f,ax=plt.subplots(figsize=(12,9))
c=corr.nlargest(k,'SalePrice')['SalePrice'].index
cm=np.corrcoef(d_train[c].values.T)
sns.set(font_scale=1.25)
hm=sns.heatmap(cm,cbar=True,annot=True,fmt='.2f',annot_kws={'size':10},yticklabels=c.values,xticklabels=c.values)
plt.show()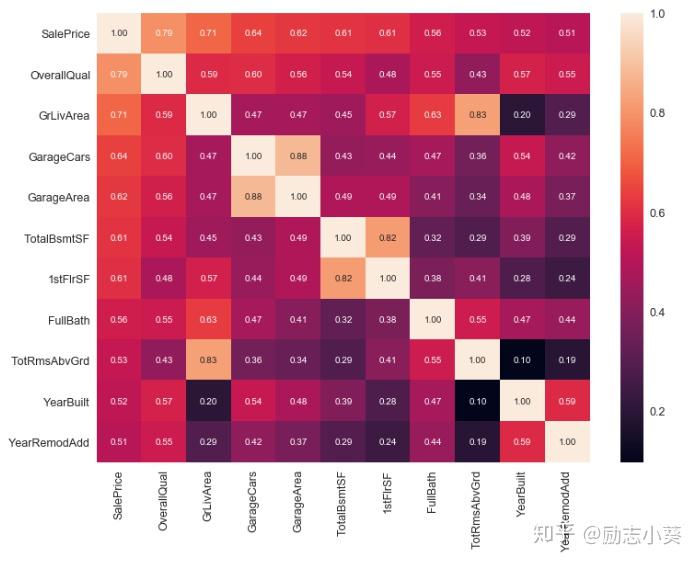
可以看出,OverallQual,GrLiveArea和SalePrice相关性最强,GarageCars,GarageArea仅次其后,由于这两个特征代表的含义基本相同,因此可以选其中一个,这里选择GarageArea.TotalBsmtSF和1stFlrSF两个特征可以选择其中一个,这里选择TotalBsmtSF.
sns.set()
c_scatter=['SalePrice','OverallQual','GrLivArea','GarageArea','TotalBsmtSF','FullBath','YearBuilt']
pair_scatter=sns.pairplot(d_train[c_scatter],size=2.5)
plt.show()
#仅截取第一行
从散点图可以看出,SalePrice和OverallQual呈指数相关,SalePrice和YearBuilt呈线性或指数相关,SalePrice和FullBath呈正相关,SalePrice和GrLivArea呈线性相关,SalePrice和GarageArea呈线性相关,SalePrice和TotalBsmtSF呈线性或相关。
1.对变量类型进行分类
字符型:PoolQC , MiscFeature, Alley, Fence, FireplaceQu, GarageType, GarageFinish, GarageQual, GarageCond,BsmtQual, BsmtCond, BsmtExposure, BsmtFinType1, BsmtFinType2, MasVnrType, MSSubClass等
数值型:BsmtUnfSF,TotalBsmtSF,BsmtFinSF2,BsmtFinSF1,BsmtFullBath,BsmtHalfBath,
MasVnrArea,GarageCars,GarageArea等
时间序列:YearBuilt,YearRemodAdd,GarageYrBlt等
2.异常值处理
散点图可用来判断数据是否存在异常值。针对影响房价的四个变量OverallQual,YearBuilt,TotalBsmtSF,GrLivArea,同目标变量做出如下散点图:
plt.figure(figsize=(18,12))

plt.subplot(2, 2, 1)
plt.scatter(x=d_train.OverallQual, y=d_train.SalePrice,color='b')
plt.xlabel("OverallQual", fontsize=13)
plt.ylabel("SalePrice", fontsize=13)
plt.subplot(2, 2, 2)
plt.scatter(x=d_train.YearBuilt, y=d_train.SalePrice,color='b')
plt.xlabel("YearBuilt", fontsize=13)
plt.ylabel("SalePrice", fontsize=13)
plt.subplot(2, 2, 3)
plt.scatter(x=d_train.TotalBsmtSF, y=d_train.SalePrice,color='b')
plt.xlabel("TotalBsmtSF", fontsize=13)
plt.ylabel("SalePrice", fontsize=13)
plt.subplot(2, 2, 4)
plt.scatter(x=d_train.GrLivArea, y=d_train.SalePrice,color='b')
plt.xlabel("GrLivArea", fontsize=13)
plt.ylabel("SalePrice", fontsize=13)
plt.show()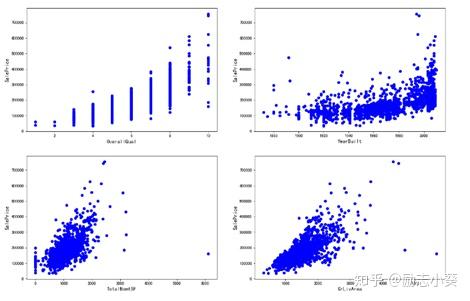
从散点图可以看出,存在异常值。
下面先来删除异常值
# 删除异常值
d_train.drop(d_train[(d_train['OverallQual']<5) & (d_train['SalePrice']>200000)].index,inplace=True)
d_train.drop(d_train[(d_train['YearBuilt']<1900) & (d_train['SalePrice']>400000)].index,inplace=True)
d_train.drop(d_train[(d_train['YearBuilt']>1980) & (d_train['SalePrice']>700000)].index,inplace=True)
d_train.drop(d_train[(d_train['TotalBsmtSF']>6000) & (d_train['SalePrice']<200000)].index,inplace=True)
d_train.drop(d_train[(d_train['GrLivArea']>4000) & (d_train['SalePrice']<200000)].index,inplace=True)
# 重置索引,使得索引值连续
d_train.reset_index(drop=True, inplace=True)
数据列中的ID和数据分析无关,先删除
train_id=d_train['Id']
test_id=d_test['Id']
d_train.drop("Id", axis=1, inplace=True)
d_test.drop("Id", axis=1, inplace=True)
3.下面首先合并训练集和测试集,以便进一步做数据清洗和特征工程。
full_data=pd.concat([d_train,d_test],axis=0)
full_data.reset_index(drop=True, inplace=True) # 重置索引,使得索引值连续
display(d_train.shape)
display(d_test.shape)
display(full_data.shape)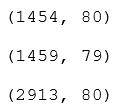
4.缺失值处理
- 用平均值、中值、分位数、众数等填充。
- 删除缺失较多的数据。
- 把变量映射到高维空间。比如性别,有男、女、缺失三种情况,则映射成3个变量:是否男、是否女、是否缺失。
首先对缺失值进行统计
num=full_data.isnull().sum().sort_values(ascending=False)
per=num/len(full_data)
nulldata=pd.concat([num,per],axis=1,keys=['num','per'])
nulldata[nulldata.per>0]# del num, per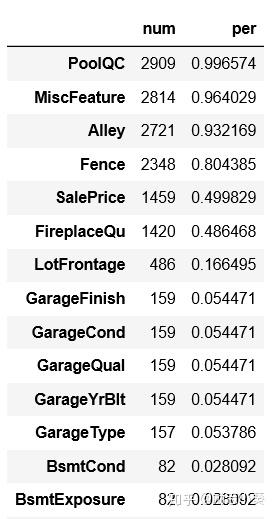
下面对缺失值进行填充
#字符类型数据,用None填充
strc=["PoolQC" , "MiscFeature", "Alley", "Fence", "FireplaceQu", "GarageType", "GarageFinish", "GarageQual", "GarageCond",  "BsmtQual", "BsmtCond", "BsmtExposure", "BsmtFinType1", "BsmtFinType2", "MasVnrType", "MSSubClass"]
for c in strc:
    full_data[c].fillna("None",inplace=True)
del strc,c

#数值类型数据
##用0填充
numc=["BsmtUnfSF","TotalBsmtSF","BsmtFinSF2","BsmtFinSF1","BsmtFullBath","BsmtHalfBath",
          "MasVnrArea","GarageCars","GarageArea","GarageYrBlt"]
for c in numc:
    full_data[c].fillna(0, inplace=True)

##用众数填充
otherc=["MSZoning", "Electrical", "KitchenQual", "Exterior1st", "Exterior2nd", "SaleType"]
for c in otherc:
    full_data[c].fillna(full_data[c].mode()[0], inplace=True)

##用相邻值填充
full_data["LotFrontage"]=full_data.groupby("Neighborhood")["LotFrontage"].transform(lambda x: x.fillna(x.median()))
full_data["Functional"]=full_data["Functional"].fillna("Typ")

##删除部分变量
all_data=all_data.drop(["Utilities"], axis=1)

#查看是否处理完全
num=full_data.isnull().sum().sort_values(ascending=False)
per=num/len(full_data)
nulldata=pd.concat([num,per],axis=1,keys=['num','per'])
nulldata[nulldata.per>0]# del num, per
发现仅有SalePrice列含有缺失值。缺失值处理完成。
1.序号编码
序号编码用于处理类别间具有大小关系的数据。例如成绩可以分为低、中、高三档,并且存在高>中>低的排序关系。
需要做序号编码的变量如下:
'BsmtFinType1','MasVnrType','Foundation','HouseStyle','Functional','BsmtExposure','GarageFinish','PavedDrive','Street','ExterQual','PavedDrive','ExterQua','ExterCond','KitchenQual','HeatingQC','BsmtQual','FireplaceQu','GarageQual','PoolQC'
#部分代码如下:
#定义函数对顺序变量进行编码
def map_b(df):
    df['MSZoning']=df['MSZoning'].map({'C (all)':1, 'RM':2, 'RH':2, 'RL':3, 'FV':4})
    df['Neighborhood']=df['Neighborhood'].map({'MeadowV':1,
                                               'IDOTRR':2, 'BrDale':2,
                                               'OldTown':3, 'Edwards':3, 'BrkSide':3,
                                               'Sawyer':4, 'Blueste':4, 'SWISU':4, 'NAmes':4,
                                               'NPkVill':5, 'Mitchel':5,
                                               'SawyerW':6, 'Gilbert':6, 'NWAmes':6,
                                               'Blmngtn':7, 'CollgCr':7, 'ClearCr':7, 'Crawfor':7,
                                               'Veenker':8, 'Somerst':8, 'Timber':8,
                                               'StoneBr':9,
                                               'NoRidge':10, 'NridgHt':10})
    df['HouseStyle']=df['HouseStyle'].map({'1.5Unf':1,
                                           '1.5Fin':2, '2.5Unf':2, 'SFoyer':2,
                                           '1Story':3, 'SLvl':3,
                                           '2Story':4, '2.5Fin':4})
    df['MasVnrType']=df['MasVnrType'].map({'BrkCmn':1, 'None':1, 'BrkFace':2, 'Stone':3})
    df['ExterQual']=df['ExterQual'].map({'Po':1, 'Fa':2, 'TA':3, 'Gd':4, 'Ex':5})
    df['ExterCond']=df['ExterCond'].map({'Po':1, 'Fa':2, 'TA':3, 'Gd':4, 'Ex':5})
    df['Foundation']=df['Foundation'].map({'Slab':1, 'BrkTil':2, 'CBlock':2, 'Stone':2, 'Wood':3, 'PConc':4})
    df['BsmtQual']=df['BsmtQual'].map({'None':1, 'Po':2, 'Fa':3, 'TA':4, 'Gd':5, 'Ex':6})
    df['BsmtCond']=df['BsmtCond'].map({'None':1, 'Po':2, 'Fa':3, 'TA':4, 'Gd':5, 'Ex':6})
    df['BsmtExposure']=df['BsmtExposure'].map({'None':1, 'No':2, 'Mn':3, 'Av':4, 'Gd':5})
map_b(full_data)
2.将部分数值转换为类别变量
cs=['MSSubClass', 'YrSold', 'MoSold', 'OverallCond', "MSZoning", "BsmtFullBath", "BsmtHalfBath", "HalfBath",\\ "Functional", "Electrical", "KitchenQual","KitchenAbvGr", "SaleType", "Exterior1st", "Exterior2nd", "YearBuilt", \\ "YearRemodAdd", "GarageYrBlt","BedroomAbvGr","LowQualFinSF"]
for c in cs:
    full_data[c]=full_data[c].astype(str)
3.对年份类的数据等进行LabelEncoder编码
# 年份等特征的标签编码
strc=["YearBuilt", "YearRemodAdd", 'GarageYrBlt', "YrSold", 'MoSold']
for c in strc:
    full_data[col]=LabelEncoder().fit_transform(full_data[col])
4.增添特征
#房屋总面积=地下室面积+一楼面积+二楼面积
full_data['totalarea']=full_data['TotalBsmtSF']+ full_data['1stFlrSF']+ full_data['2ndFlrSF']
5.对目标变量和特征变量进行纠偏(对数化处理)
直方图又称质量分布图,它是表示资料变化情况的一种主要工具。用直方图可以解析出资料的规则性,比较直观地看出产品质量特性的分布状态,对于资料分布状况一目了然,便于判断其总体质量分布情况。直方图表示通过沿数据范围形成分箱,然后绘制条以显示落入每个分箱的观测次数的数据分布。
首先观察目标变量的直方图
sns.distplot(df_train.SalePrice)
plt.show()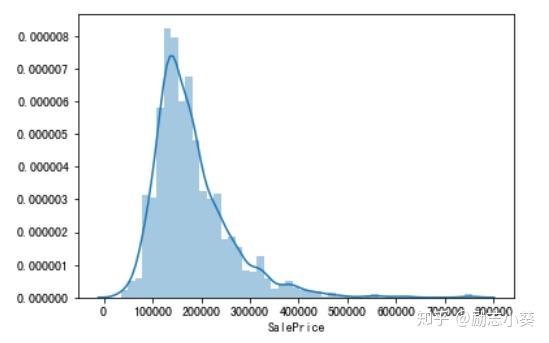
为左偏分布,下利用对数变化将其变为正态分布。
df_train["SalePrice"]=np.log1p(df_train["SalePrice"]) # 对数变换
sns.distplot(df_train.SalePrice) # 变换后的分布情况
plt.show()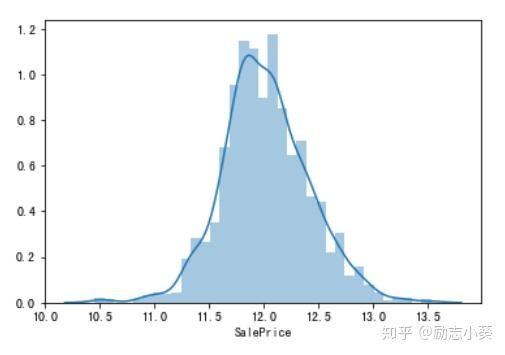
连续变量
通过对数变换改变源特征数据的分布,使其符合模型理论所需要的假设。
首先,绘制每个数值型特征与目标变量的分布情况:
num_feature_names=list(num_features.columns)
num_features_data=pd.melt(full_data, value_vars=num_feature_names)
g=sns.FacetGrid(num_features_data, col="variable", col_wrap=5, sharex=False, sharey=False)
g=g.map(sns.distplot, "value")
plt.show()
其次,计算各特征变量的偏度:
from scipy.stats import norm, skew
skewed_feats=full_data[num_feature_names].apply(lambda x: skew(x.dropna())).sort_values(ascending=False)
skewness=pd.DataFrame({'Skew' :skewed_feats})
skewness[skewness["Skew"].abs()>0.75]
最后,设置阈值为1,对偏度大于阈值的特征进行对数变换。
skewc=list(skewness[skewness["Skew"].abs()>1].index)
for c in skewc:
    full_data[c]=np.log1p(full_data[col]) # 偏度超过阈值的特征对数变换
del num_features, num_feature_names, num_features_data, g, skewed_feats, col, skew_cols # 清除临时变量
6.对分类型变量进行one-hot编码
full_data=pd.get_dummies(full_data) # 一键独热编码1.建立训练集与测试集
sourceRow=1454
source_X=all_data.loc[df_train.index]
source_y=all_data.loc[0:sourceRow-1,'SalePrice']
pred_X=all_data.loc[df_test.index]
#原始数据集
print('原始数据集有多少行:',source_X.shape)
#预测数据集
print('预测数据集:',pred_X.shape)
原始数据集有多少行: (1454, 300)
预测数据集: (1459, 300)
from sklearn.model_selection import train_test_split

#建立模型用的训练数据集和测试数据集
train_X, test_X, train_y, test_y=train_test_split(source_X ,
                                                    source_y,
                                                    train_size=.8)

#输出数据集大小
print ('原始数据集特征:',source_X.shape,
       '训练数据集特征:',train_X.shape ,
      '测试数据集特征:',test_X.shape)

print ('原始数据集标签:',source_y.shape,
       '训练数据集标签:',train_y.shape ,
      '测试数据集标签:',test_y.shape)
原始数据集特征: (1454, 300) 训练数据集特征: (1163, 300) 测试数据集特征: (291, 300)
原始数据集标签: (1454,) 训练数据集标签: (1163,) 测试数据集标签: (291,)
2.构建模型
首先利用岭回归进行建模,无需特征选取。
#Ridge回归
#定义模型
#对岭回归的正则化度进行调参,用到k折交叉检验
alphas=np.logspace(-2,2,50)
test_scores1=[]
test_scores2=[]
for alpha in alphas:
    clf=Ridge(alpha)
    scores1=np.sqrt(cross_val_score(clf,train_X,train_y,cv=5))
    scores2=np.sqrt(cross_val_score(clf,train_X,train_y,cv=10))
    test_scores1.append(1-np.mean(scores1))
    test_scores2.append(1-np.mean(scores2))
#从图中找出正则化参数alpha为时,误差最小
plt.plot(alphas,test_scores1,color='red')
plt.plot(alphas,test_scores1,color='green')
发现当alpha在0-10之间时,整体结构风险最小。
ridge=Ridge(alpha=5)
ridge.fit(train_X,train_y)
#用均方误差来判断模型好坏,结果越小越好
(((test_y-ridge.predict(test_X))**2).sum())/len(test_y)
结果为0.0017528314928632843
随机森林也可以预测回归,对处理高维度效果较好,无需特征选择。
#调参,对随机森林的最大特征选择进行调试,用到交叉验证
from sklearn.ensemble import RandomForestRegressor
from sklearn.model_selection import cross_val_score
max_features=[.1,.2,.3,.4,.5,.6,.7,.8,.9]
test_scores=[]
for max_feature in max_features:
    clf=RandomForestRegressor(max_features=max_feature,n_estimators=100)
    score=np.sqrt(cross_val_score(clf,train_X,train_y,cv=5))
    test_scores.append(1-np.mean(score))
#得出误差得分图
plt.plot(max_features,test_scores)
通过图可知,当max_features最大特征数为0.5时,误差最小,所以代入max_feature=0.5
#训练好的随机森林模型对测试集进行观测,用误差平方和来衡量模型好坏
rf=RandomForestRegressor(max_features=0.5,n_estimators=100)
rf.fit(train_X,train_y)
#用均方误差来判断模型好坏,结果越小越好
(((test_y-rf.predict(test_X))**2).sum())/len(test_y)
结果为0.0013542855550920622
因此选择随机森林算法。


